
Your Trading Data.
Your Machine.
Zero Latency.
Connect your existing broker accounts. Analyze Open Interest, PCR, and market structure with immersive 3D visualizations—all processed locally with real-time tick-by-tick updates.
Institutional-Grade Analytics
Everything you need to analyze options markets with precision and speed.
Real-Time Analysis
Track Open Interest, PCR ratios, and market sentiment as they evolve throughout the trading day.
3D Visualization
Immersive terrain maps showing OI evolution across strike prices and time dimensions.
Multi-Strike Tracking
Overlay multiple strikes on a single chart to spot correlations and divergences instantly.
Zero Latency
All data processing happens on your machine. No server round-trips, no lag, just pure speed.
Historical Backfill
Download and store historical candle data locally. Replay any trading day on demand.
Complete Privacy
Your trading data and strategies stay on your computer. Never uploaded to third-party servers.
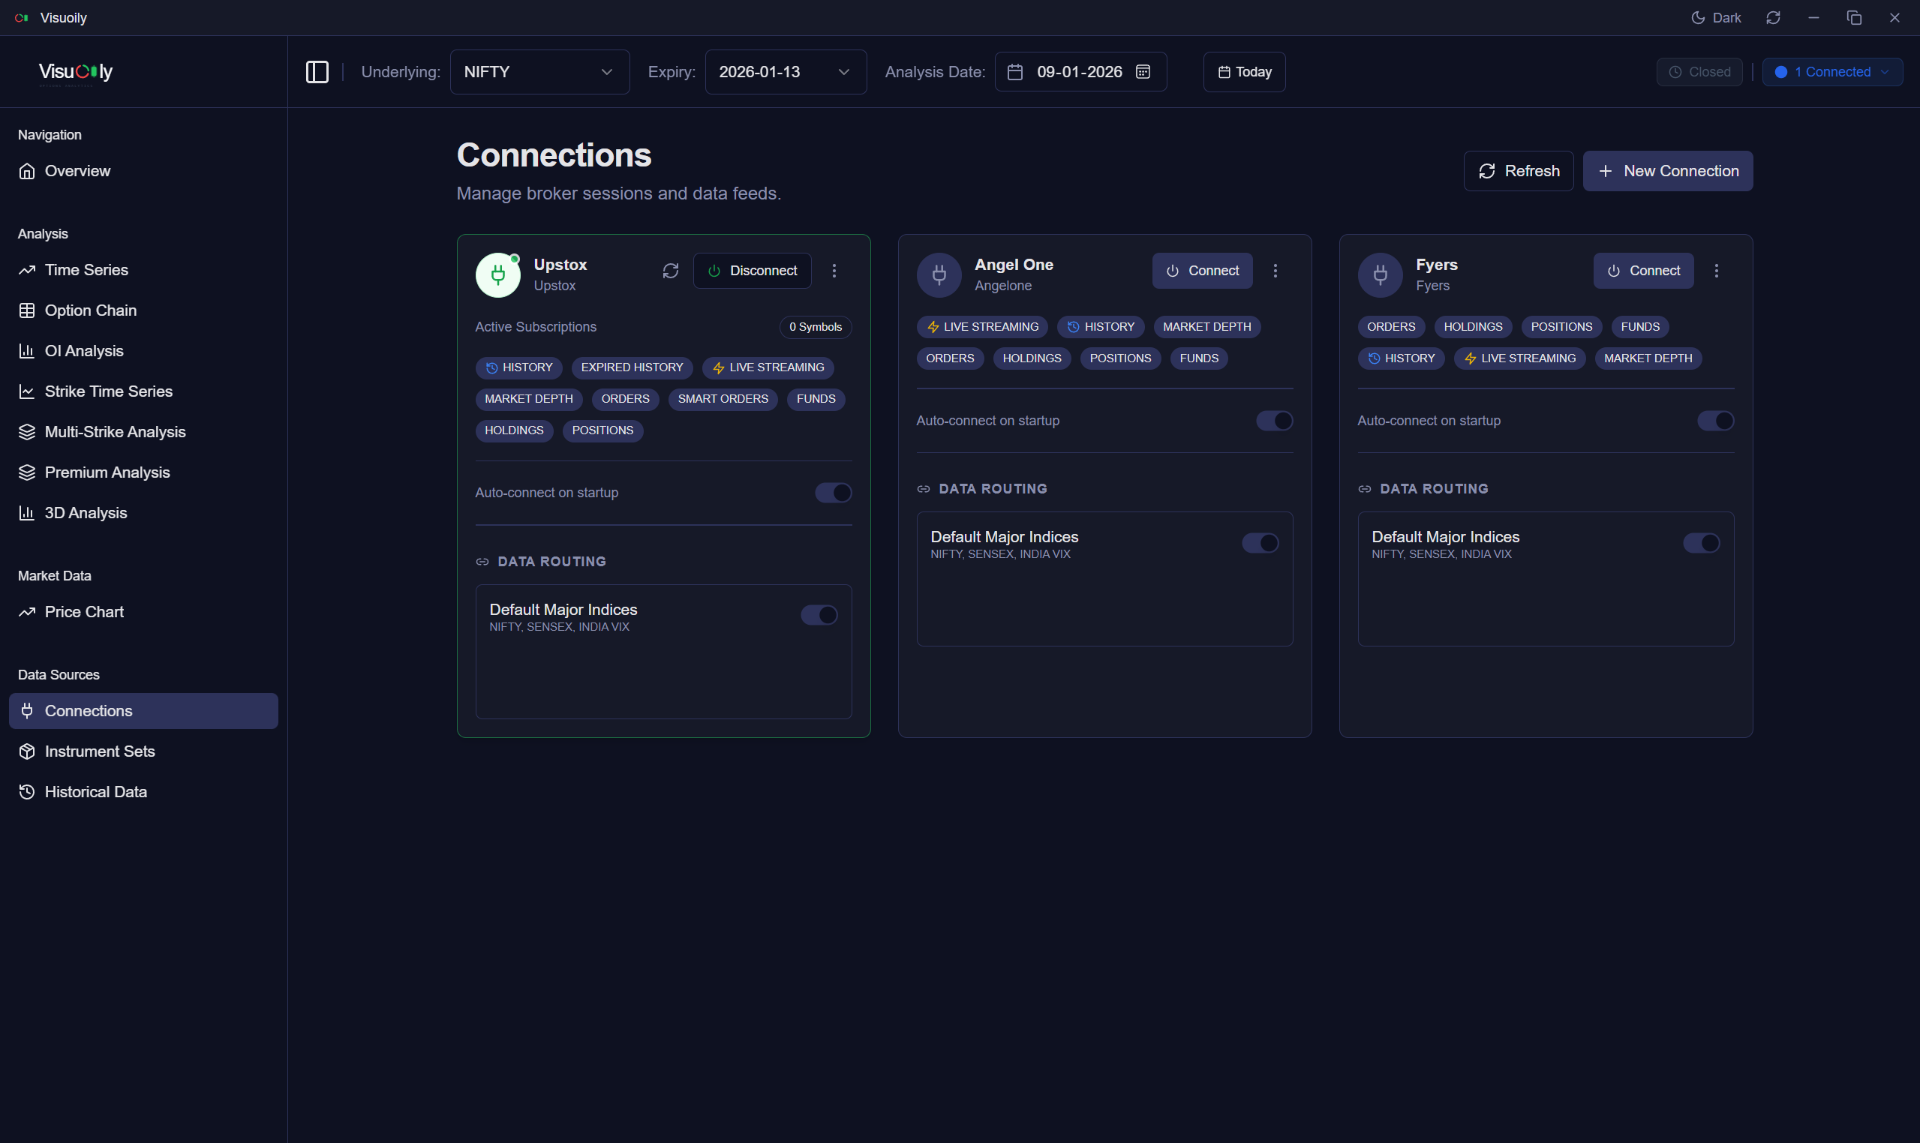
Unified Dashboard.
Multiple Brokers.
Connect your existing broker accounts and consolidate everything into one powerful analytics platform. No need to switch platforms—bring the data to your analysis.
Quick OAuth Connect
Connect any supported broker in under a minute
Auto-Reconnection
Sessions are restored automatically on app restart
Instrument Sets
Build custom logic (e.g., "NIFTY + Next Expiry") to automatically subscribe to the data you care about.
Hybrid Operation
Switch instantly between Live Mode for real-time trading and Historical Mode to analyze past market behavior.
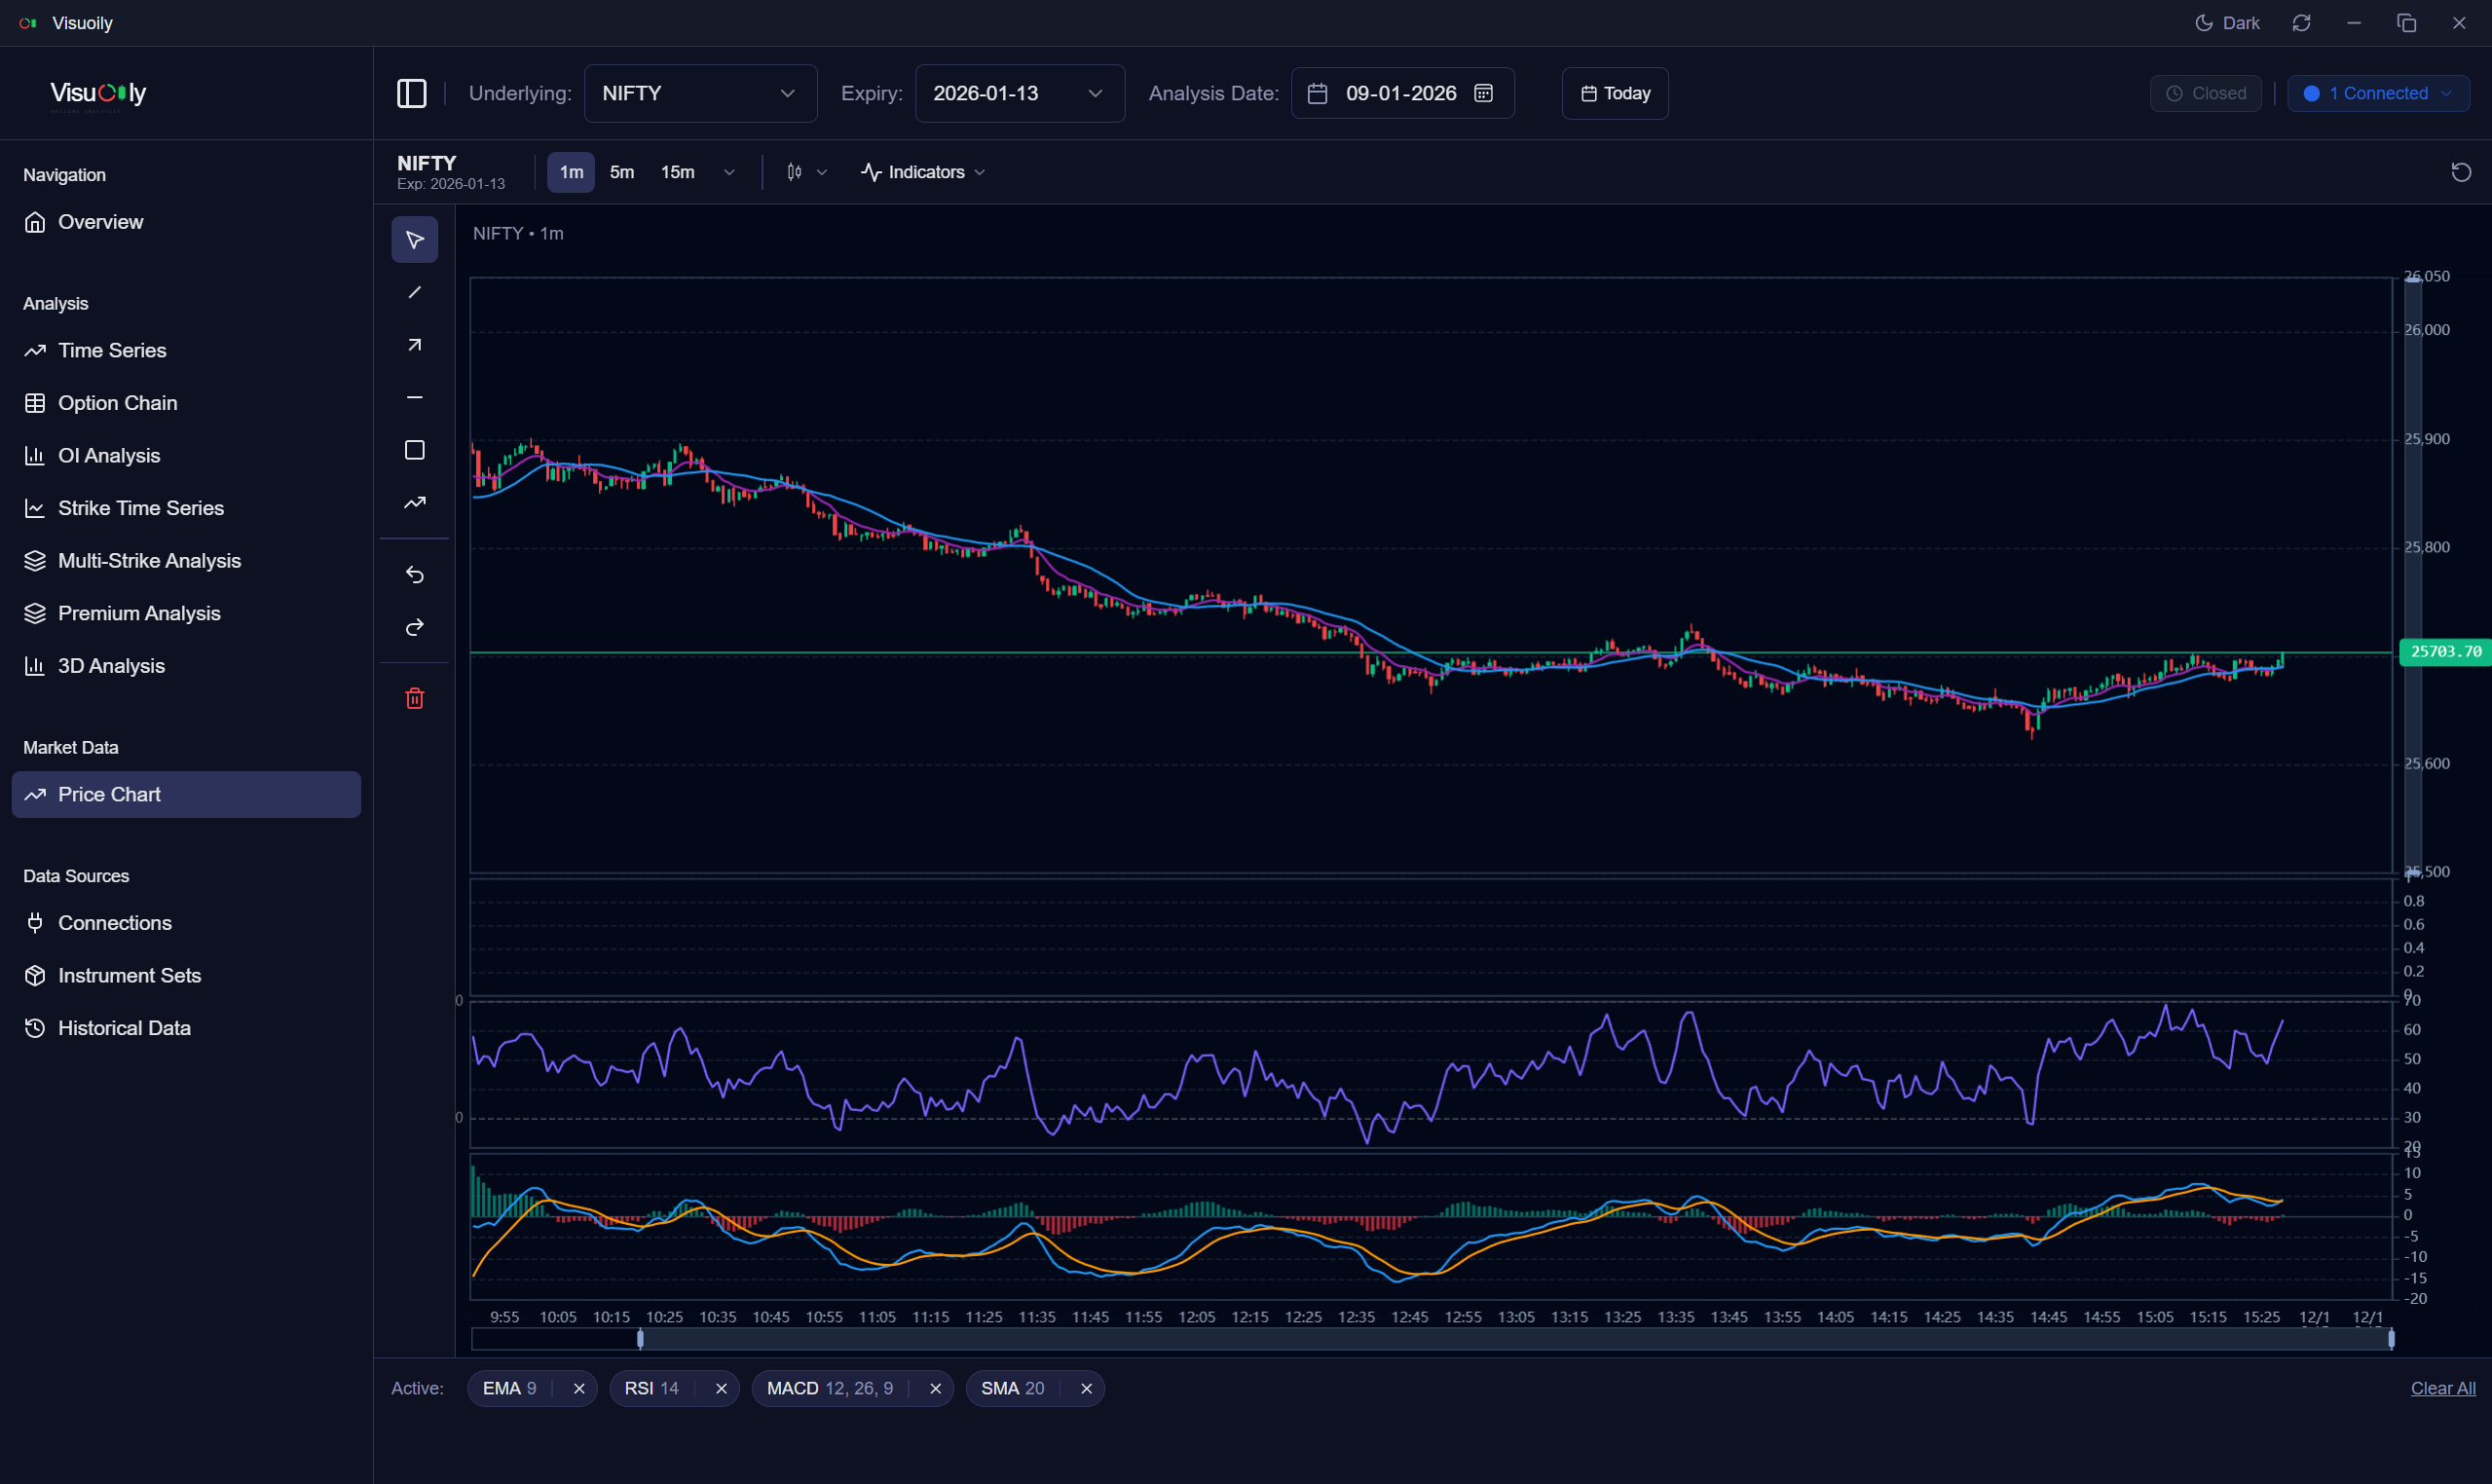
Technical Analysis.
You don't need a separate platform for charting. Visuoily includes a professional-grade charting engine fully integrated with your data feed.
Comprehensive Toolkit
Trendlines, Fibonacci Retracements, Rays, and geometric shapes.
Essential Indicators
Overlay SMA, EMA, Bollinger Bands, RSI, and MACD directly on your price data.
Multi-Timeframe
Seamlessly switch between scalping views (1m, 3m) and trend views (1h, Daily).
Advanced Charting Types
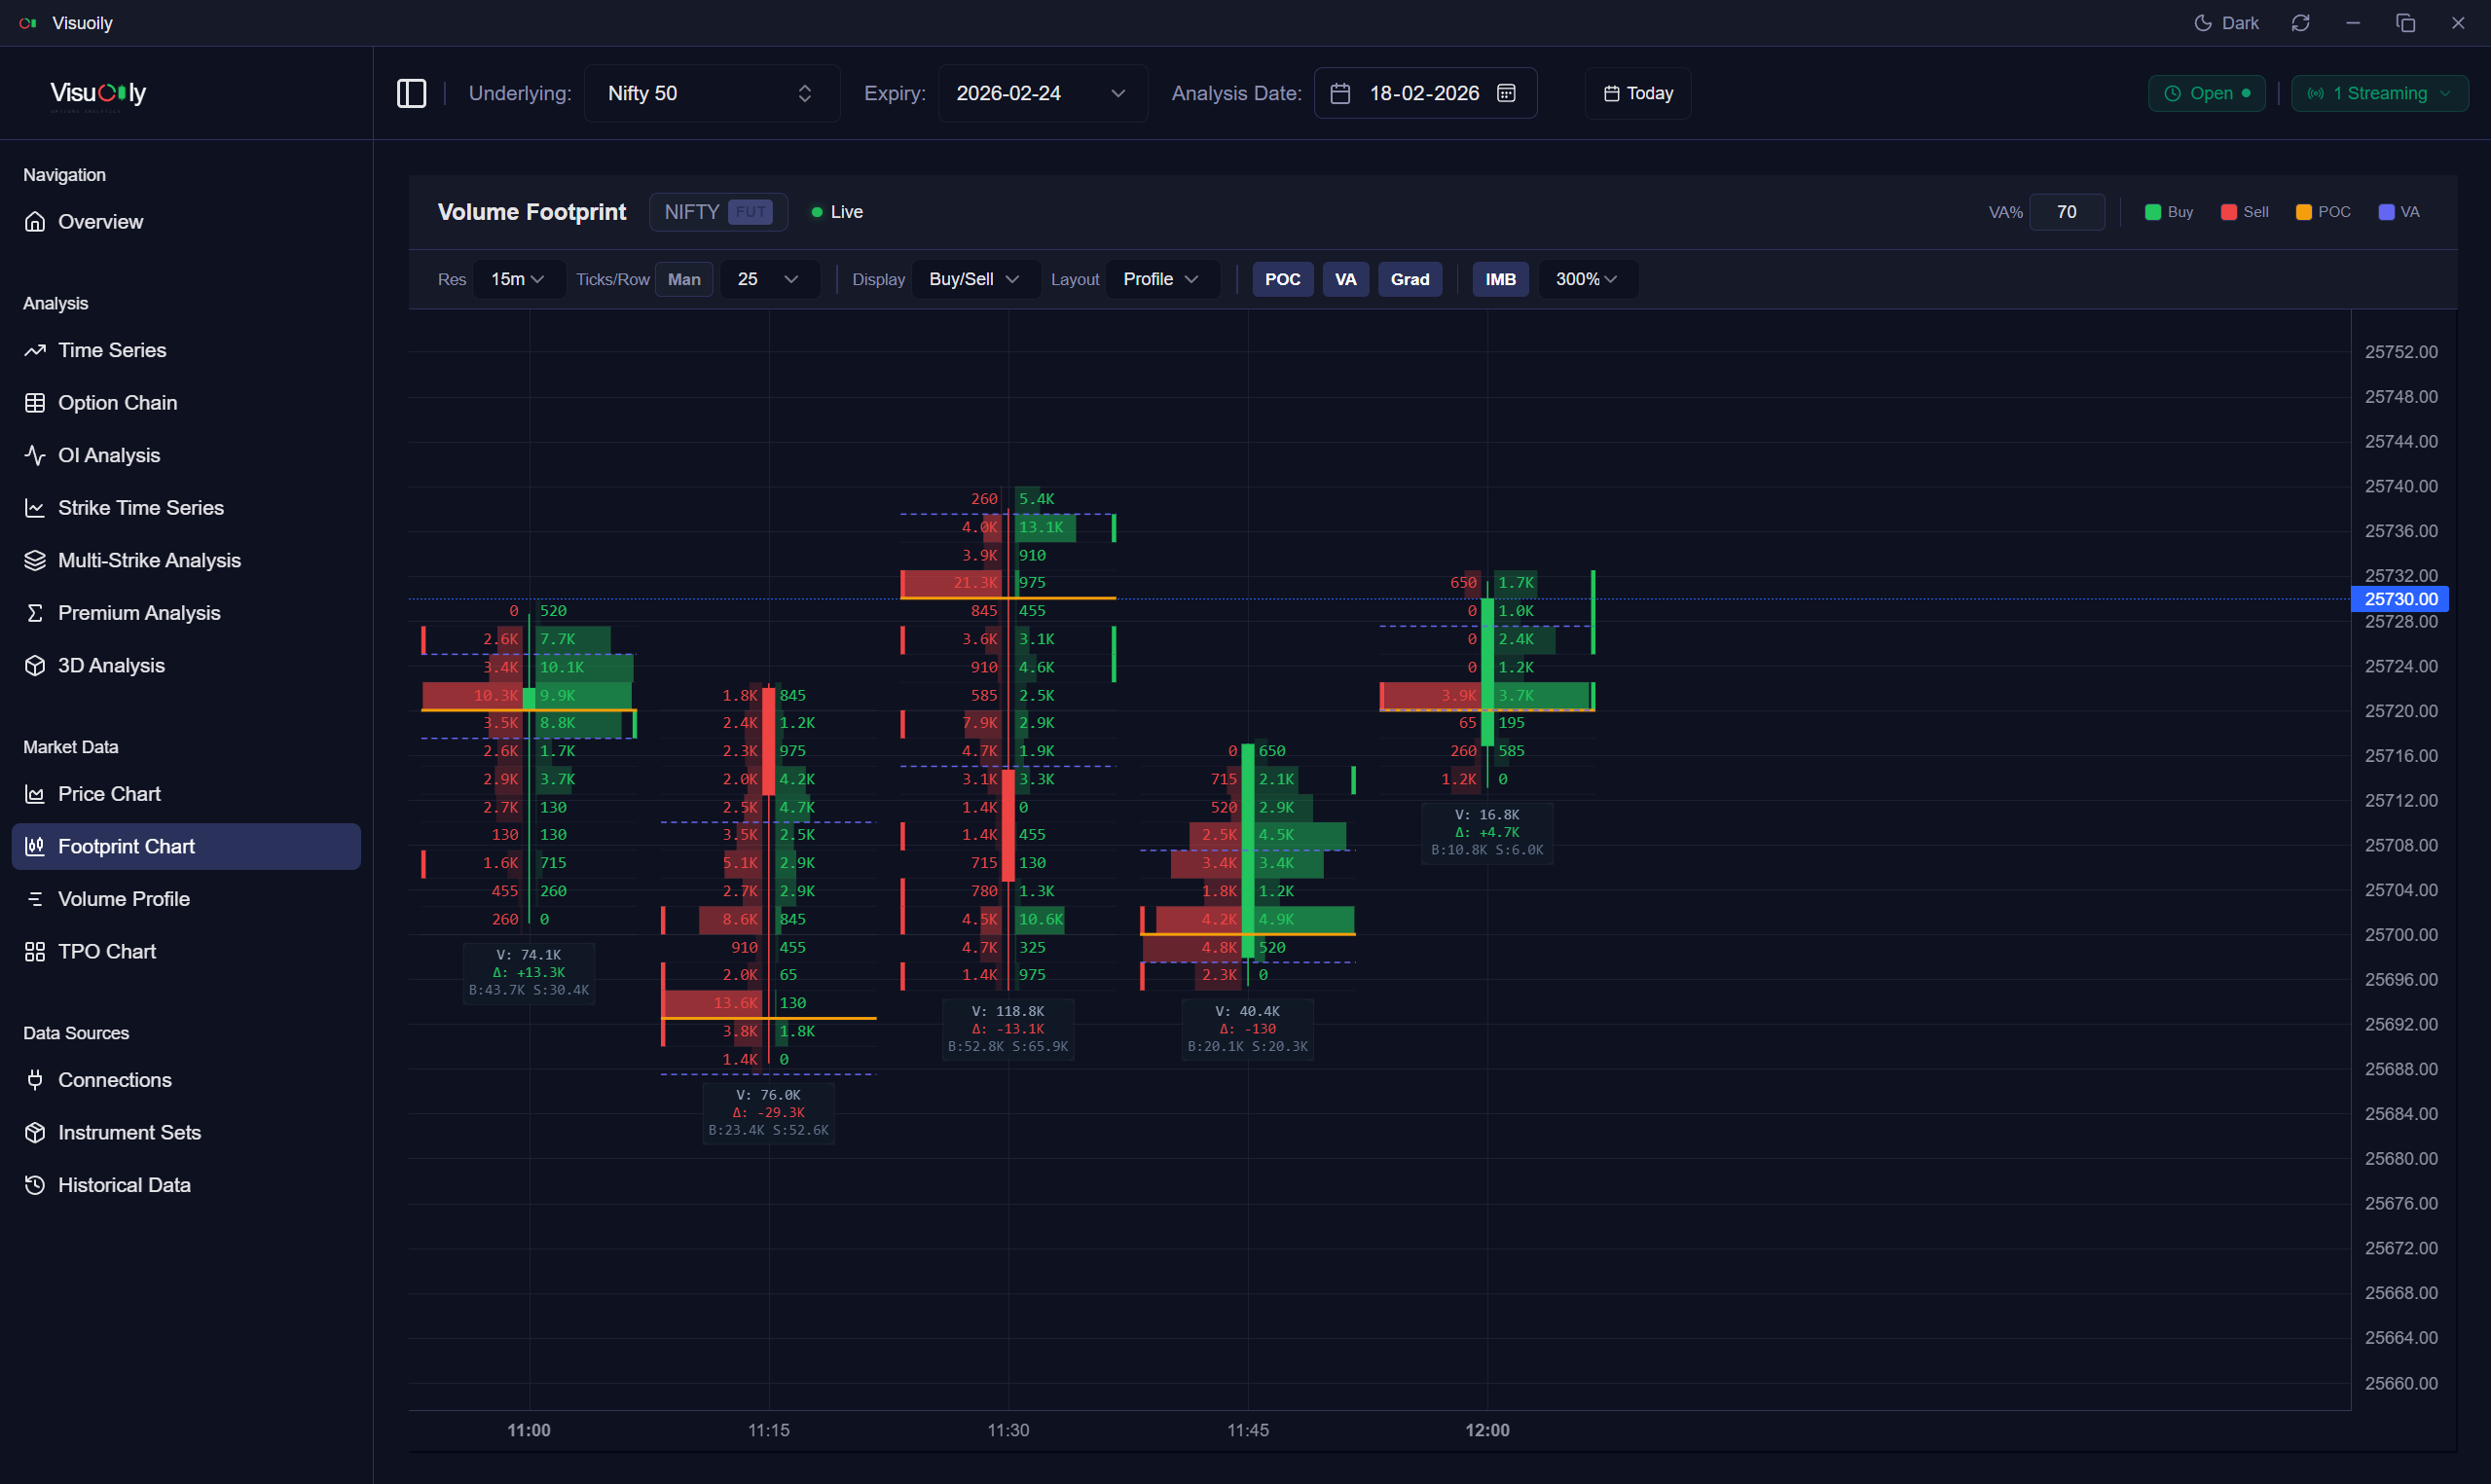
Go beyond standard candlesticks with specialized chart types designed for volume flow analysis.
Footprint Charts
Inside the Candle
Don't just guess what happened inside a candle—see it. Footprint charts reveal the volume executed at every price level, helping you spot high activity zones and volume distribution patterns in real-time.
- Volume-at-Price Clusters
- High Volume Nodes
- Volume Divergence Analysis
- Stacked Volume Zones
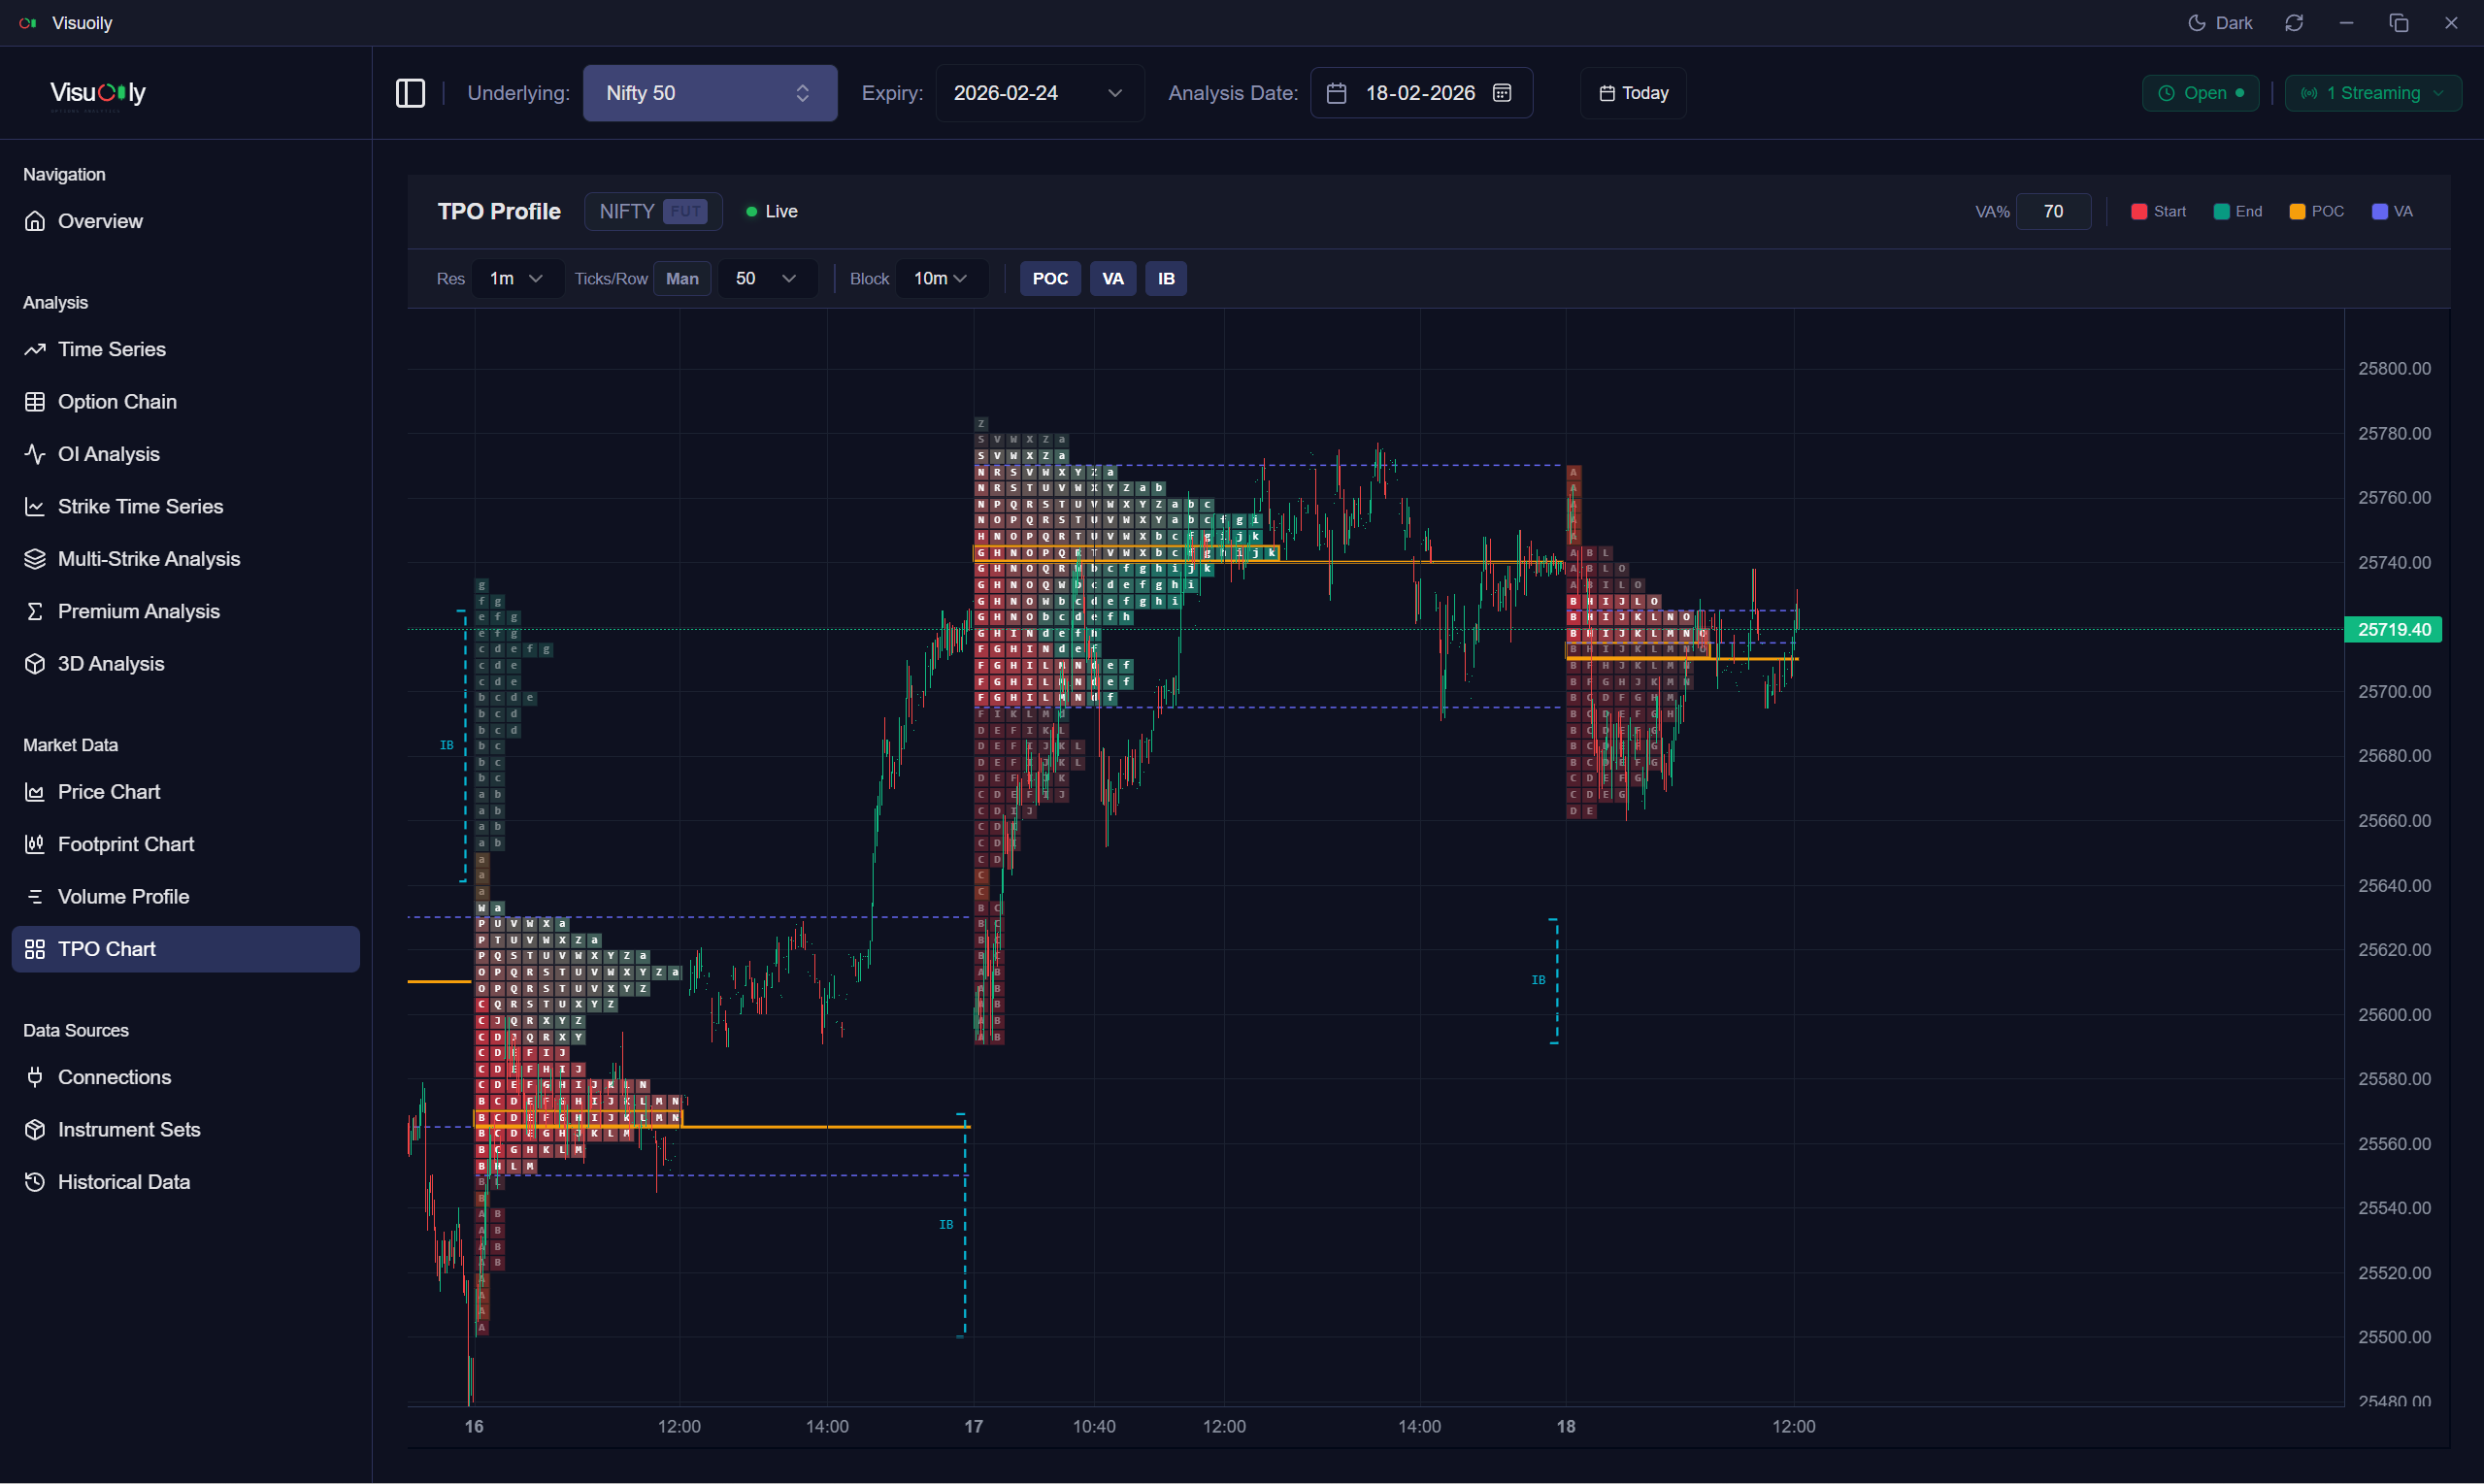
TPO Charts
Auction Market Theory
Understand market structure through time. TPO (Time Price Opportunity) charts organize price action into time-blocks, revealing where the market spent the most time and helping you identify fair value, single prints, and poor highs/lows.
- Daily & Session Splits
- Split and Merged Profile Views
- Value Area & POC Tracking
- Color-coded Time Evolution
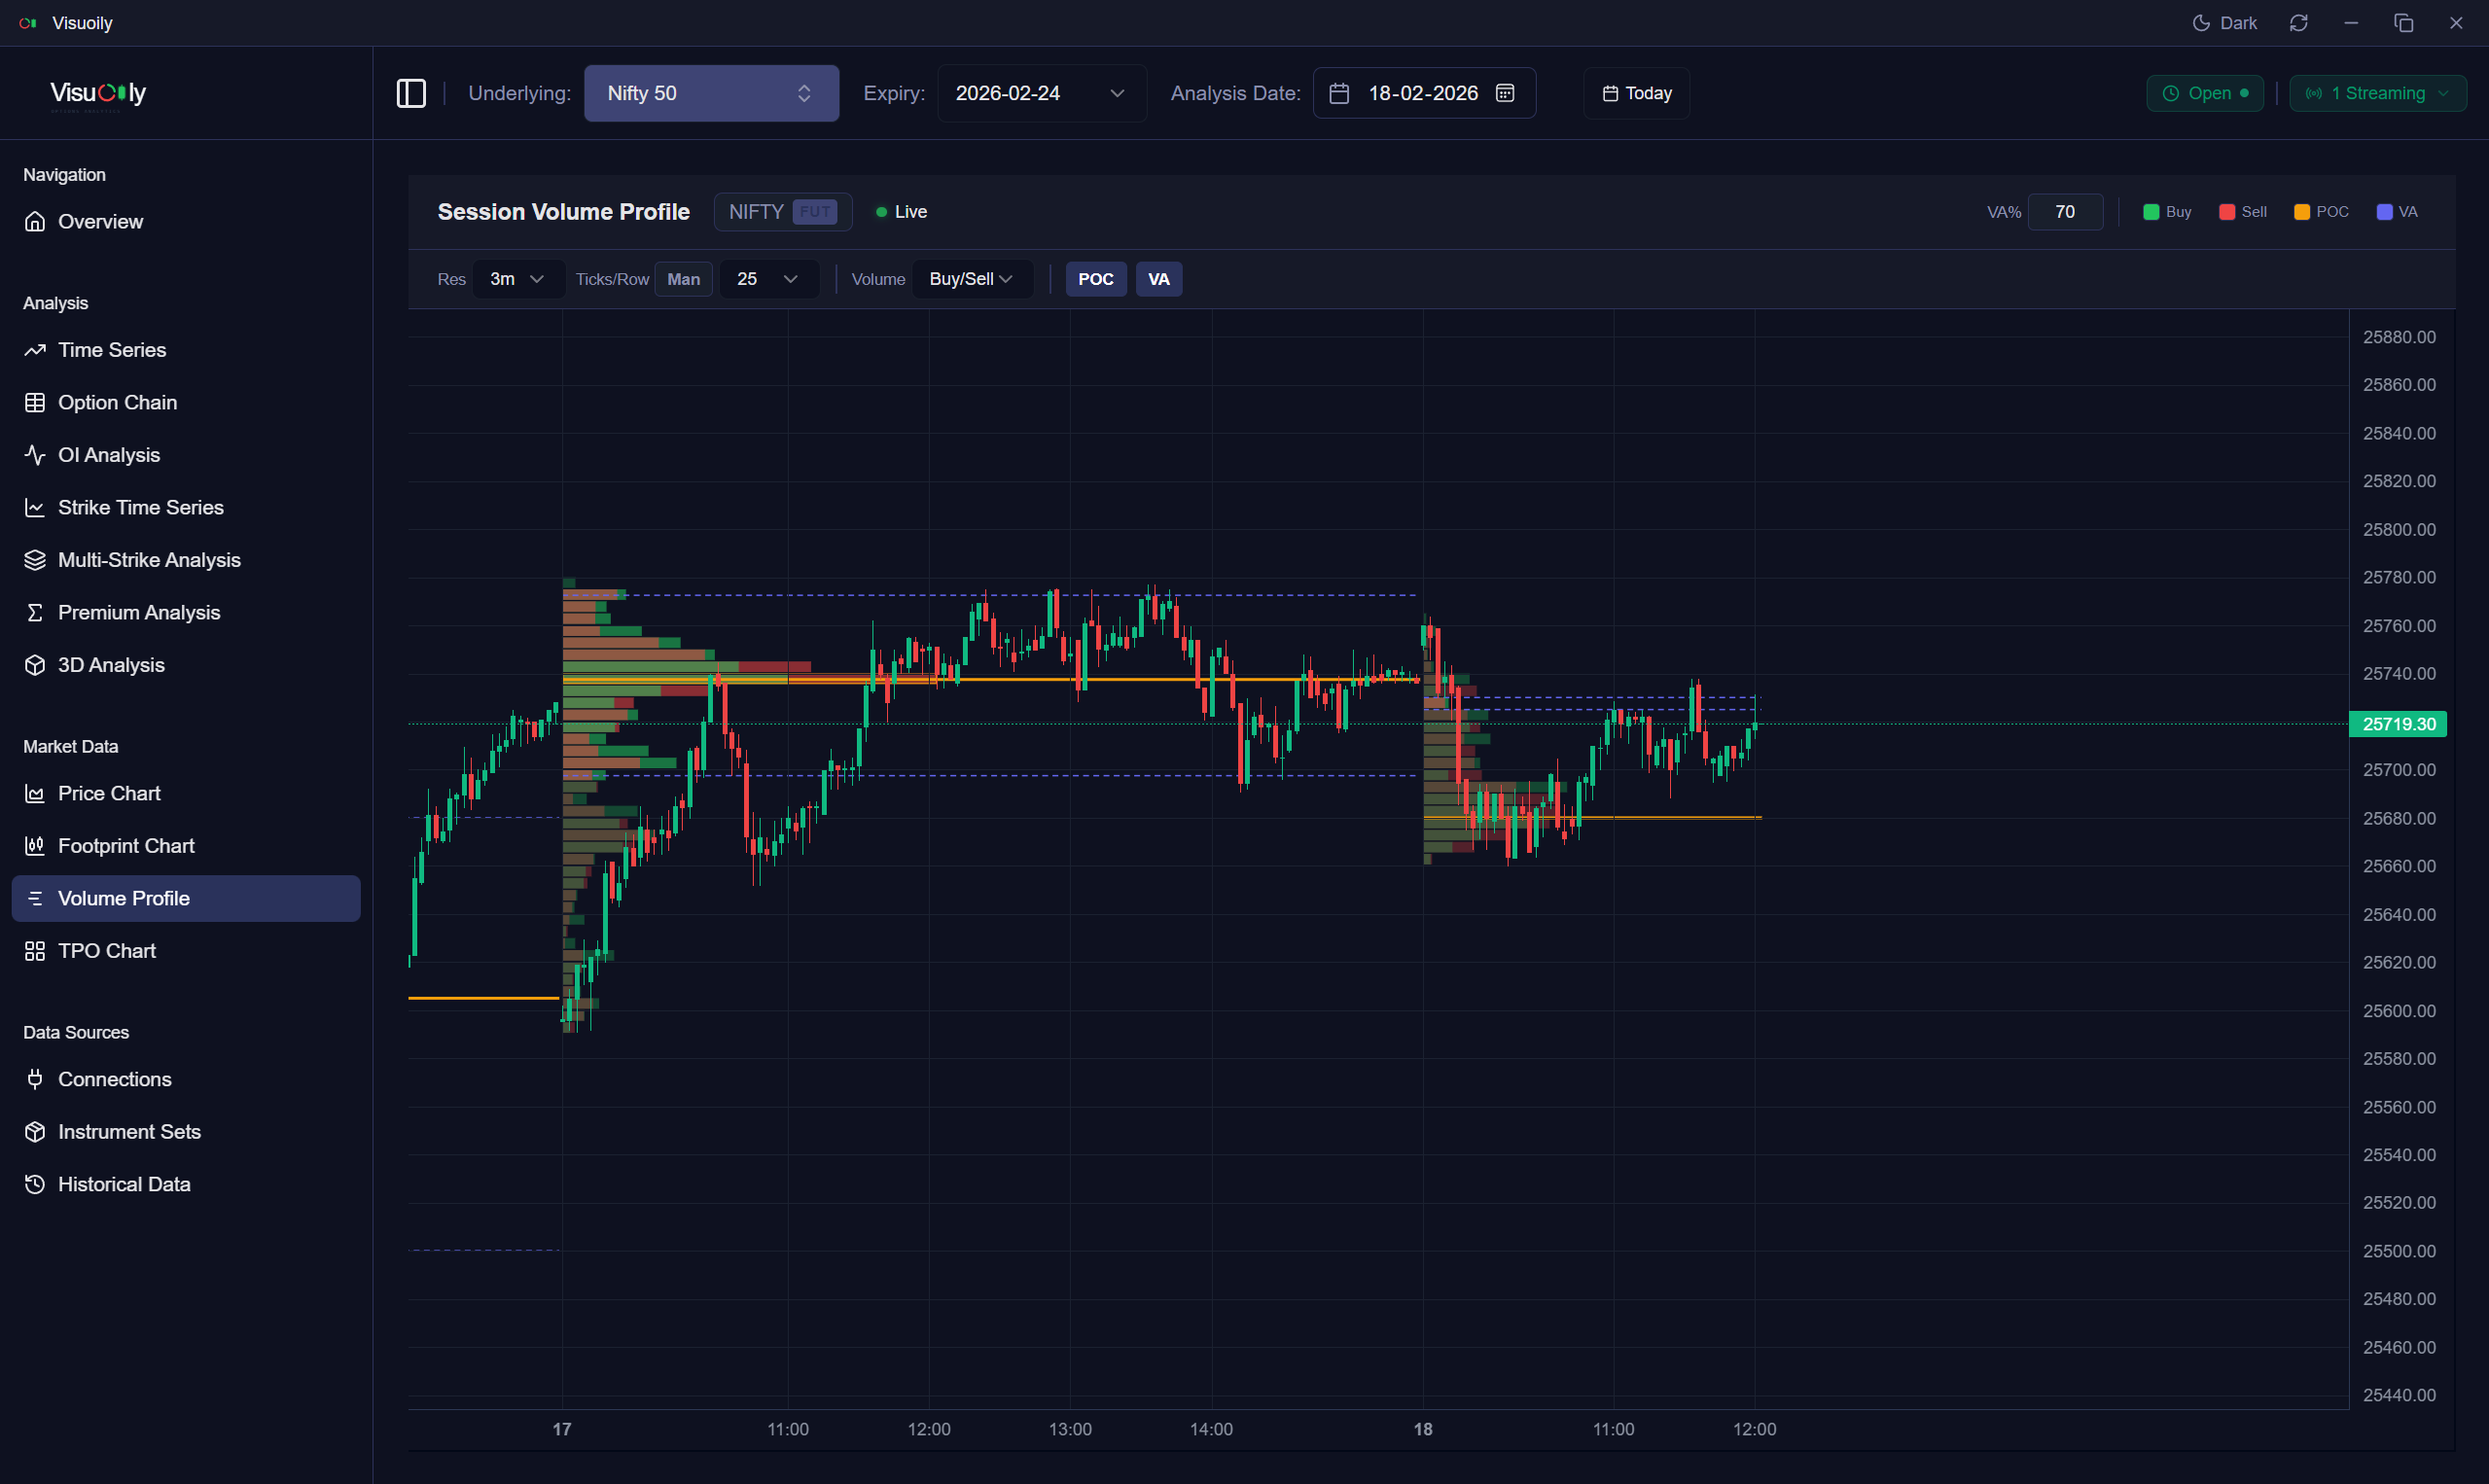
Session Volume Profile
Volume at Price
Price is advertising, Volume is acceptance. SVP displays the volume traded at each price level for the session, highlighting high-volume nodes (HVN) that act as magnets and low-volume nodes (LVN) that act as rejection.
- Developing Session Profile
- Value Area High/Low (VAH/VAL)
- Point of Control (POC) shift
- Directional Volume Split
Live Market
Demonstration
Watch how professional traders use Visuoily's advanced charting tools to spot opportunities in real-time. See the Footprint, TPO, and SVP charts work together to provide a complete picture of the market auction.
Watch on YouTubeSee Market Structure
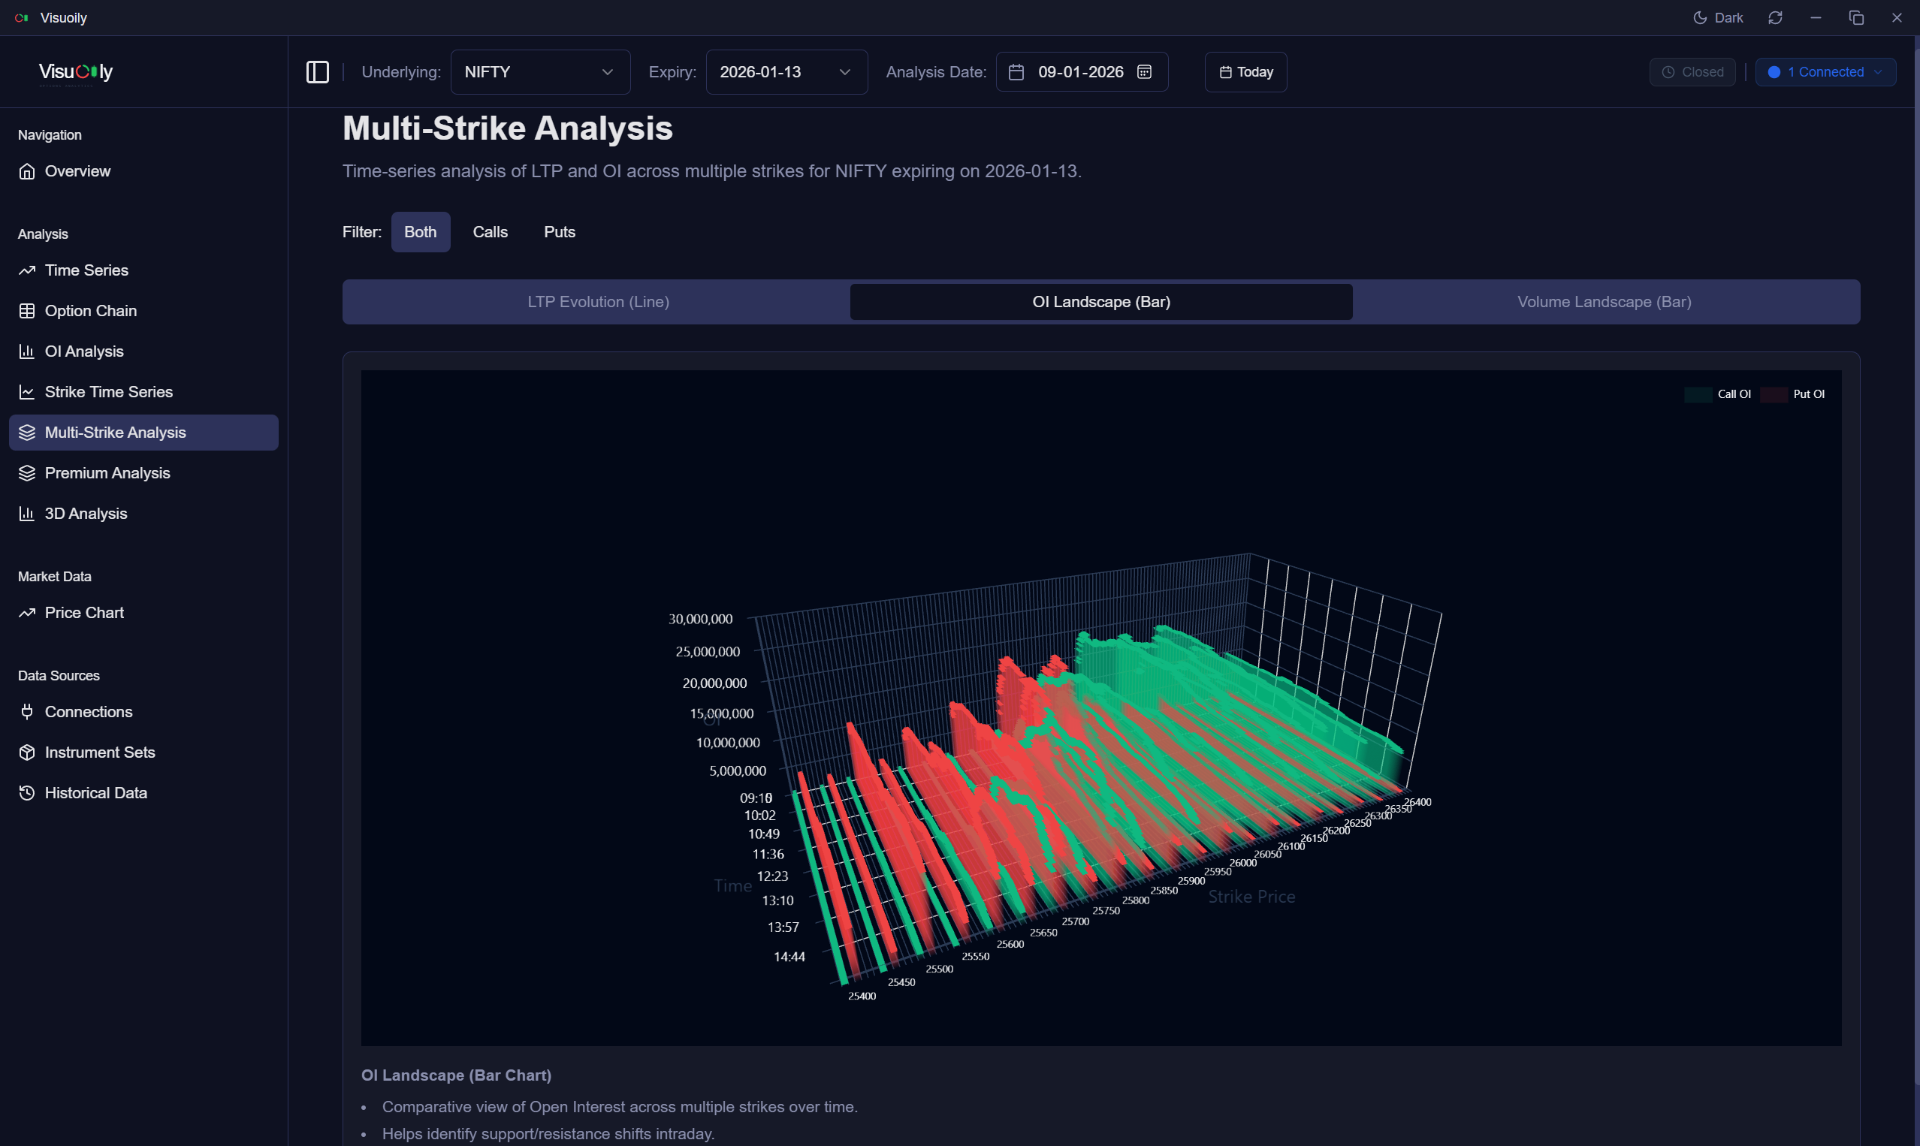
In Three Dimensions
Traditional 2D charts hide critical trends. Our immersive 3D terrain maps reveal how Open Interest shifts across strike prices throughout the trading day— helping you spot support and resistance levels that flat charts miss.
- OI Evolution Landscape across time
- Volume distribution terrain maps
- Interactive rotation and zoom
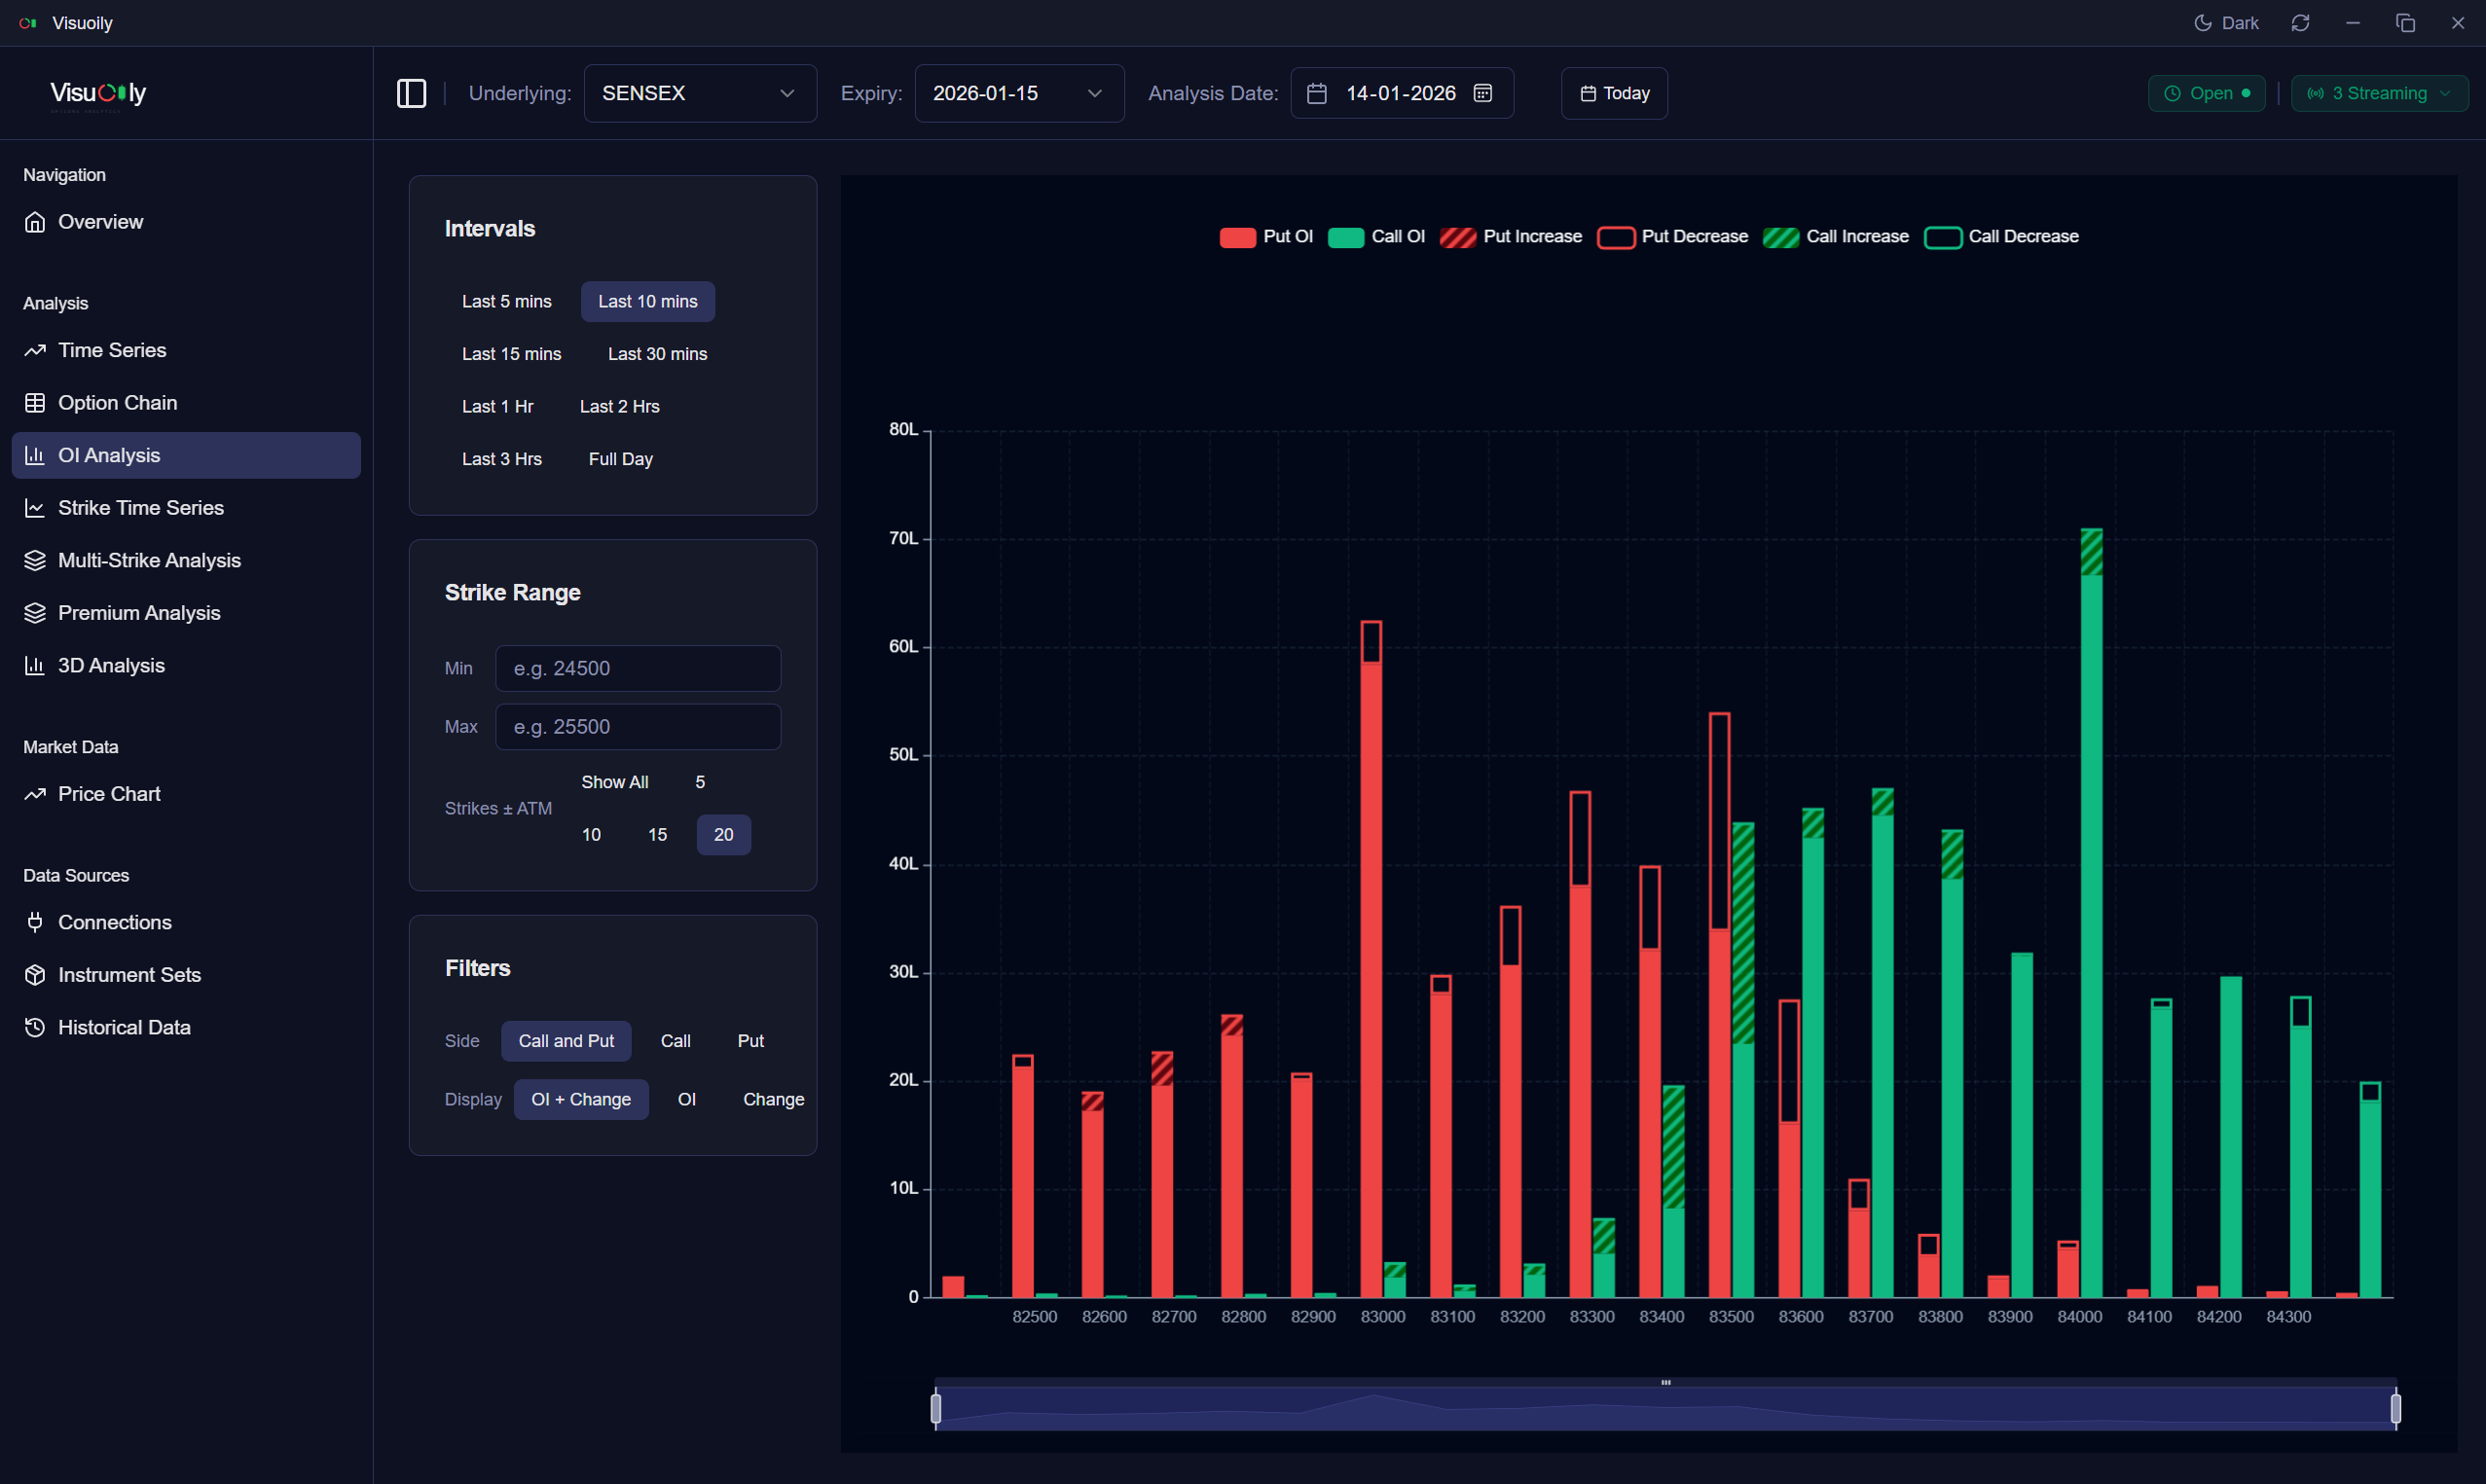
Track Open Interest
Build-Up & Unwinding
Visualize where the smart money is positioning. Our OI Analysis shows you Call vs Put open interest across all strikes, with clear indicators for build-up and unwinding patterns.
- Configurable time intervals
- Strike range filtering
- Call/Put breakdown view
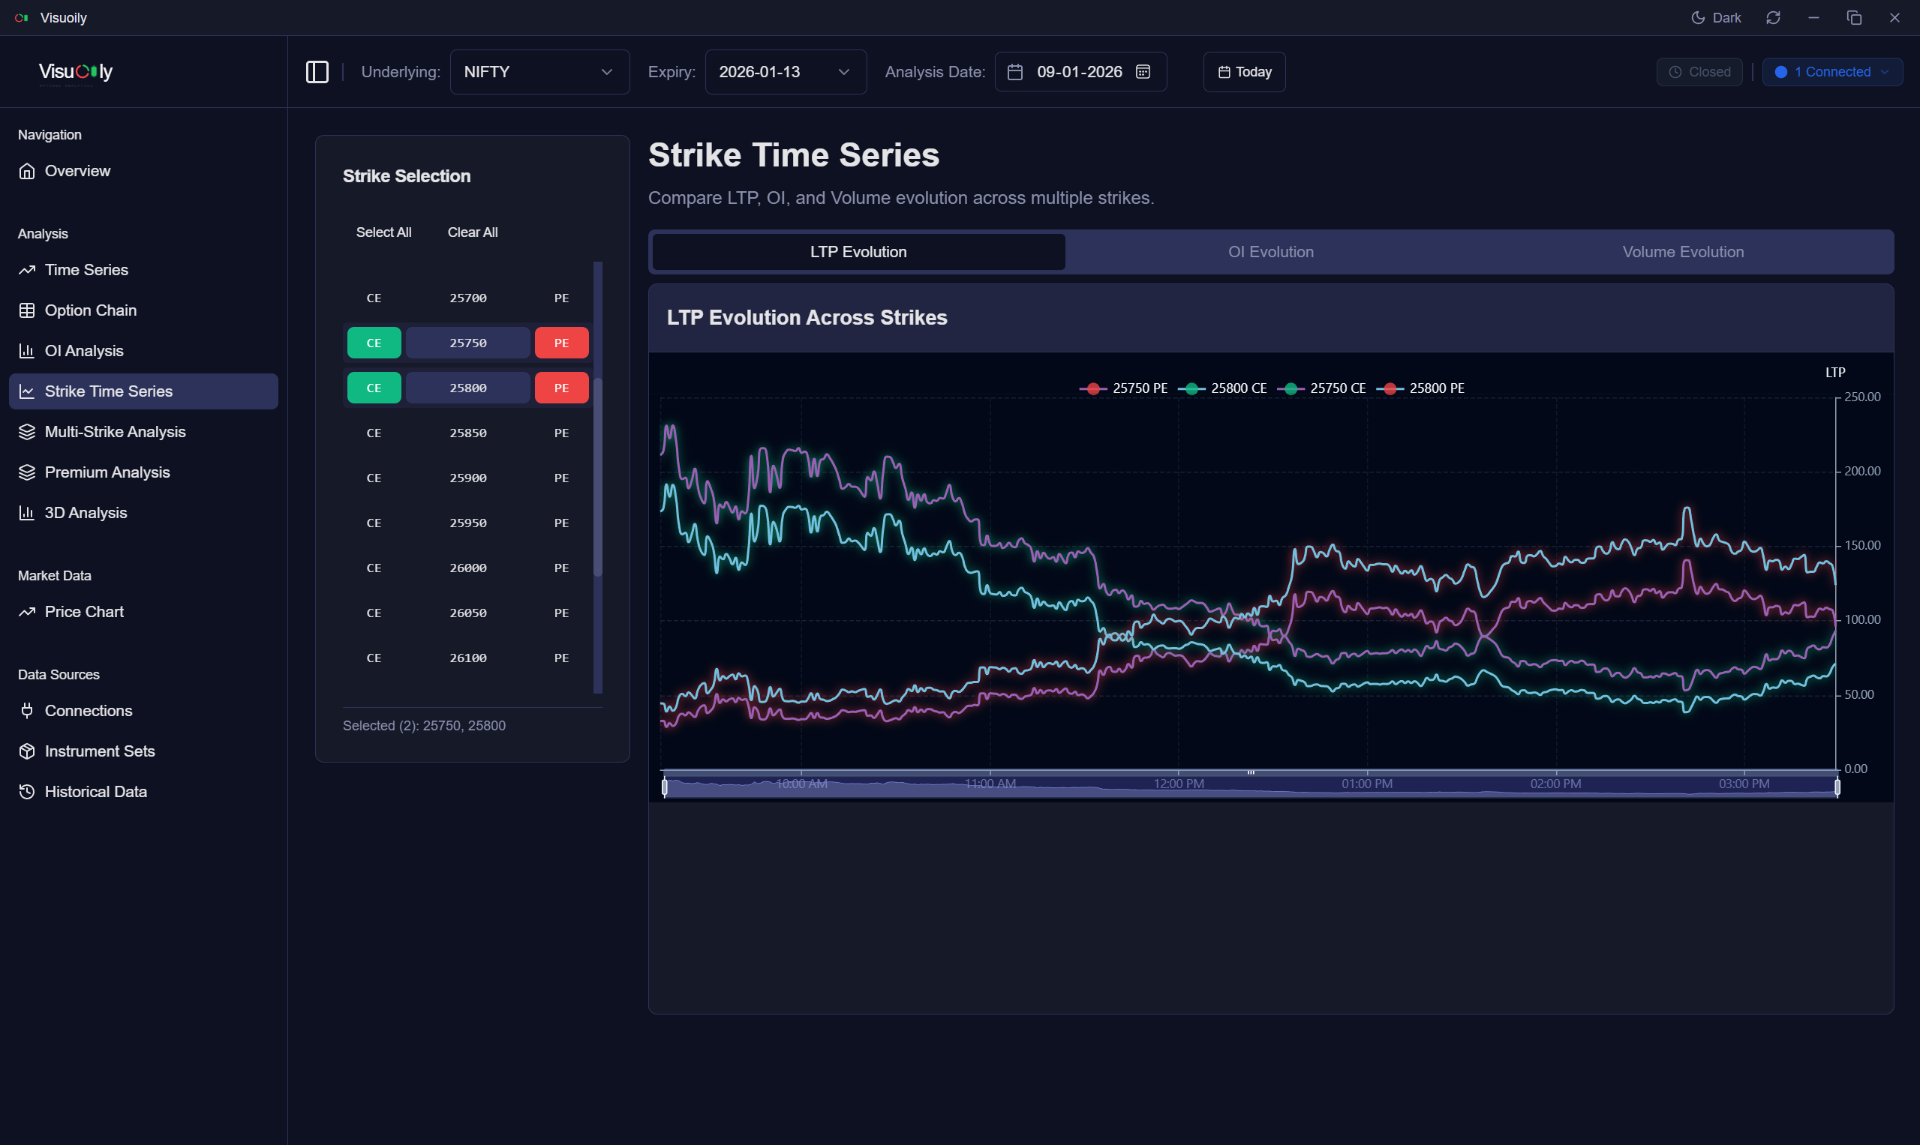
Multi-Strike
Side-by-Side Comparison
Select multiple strikes and overlay their LTP, OI, or Volume evolution on a single chart. Instantly spot divergences and correlations that signal trading opportunities.
- LTP evolution overlay
- OI trend comparison
- Volume pattern analysis
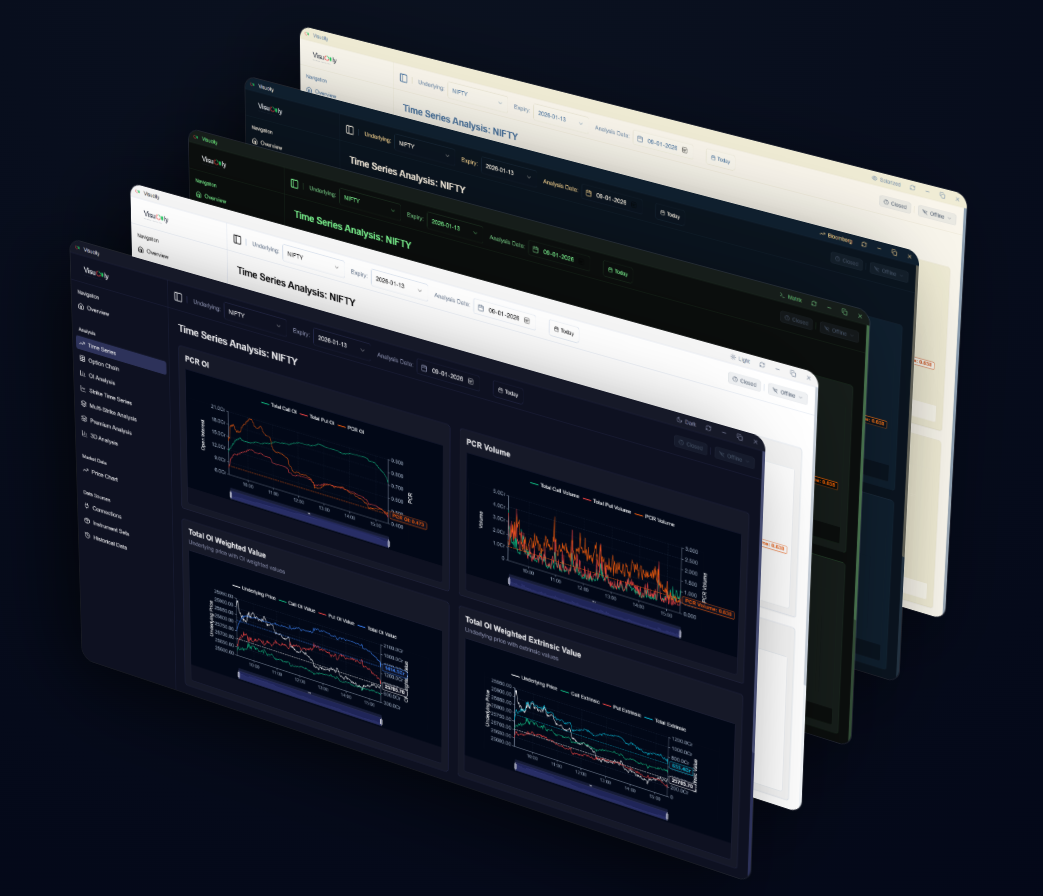
Choose Your
Trading Environment
Markets change, and so should your view. We provide five professionally designed themes to match your preferences and ambient lighting conditions— from high-contrast financial terminals to soft dark modes for night sessions.
Deep Dark
For low-light focus
Crisp Light
High legibility mode
Matrix
Hacker-green contrast
Bloomberg
Classic institutional
Ready to Trade with Clarity?
Download Visuoily and transform how you analyze the Indian options market. Your data, your machine, your edge.
Requires Windows 10 or later. Approximately 30MB download.